Topology
Topology is a map of the traffic through a gateway. It shows the path of every call, from the agent that made it to the connection that reached your API, and it is built from the gateway's configuration and its logs. Topology is in beta.
Where it is
| Place | What it shows |
|---|---|
| The Topology tab of a gateway | One gateway, for the environment selected in the gateway header. |
| The Topology button on the Agent Gateway list | Every gateway of the workspace. Choose a gateway in the All gateways menu to show only that one. |
| The How traffic flows card on a gateway's Overview tab | A small read-only version. Select it to open the tab. |
The map
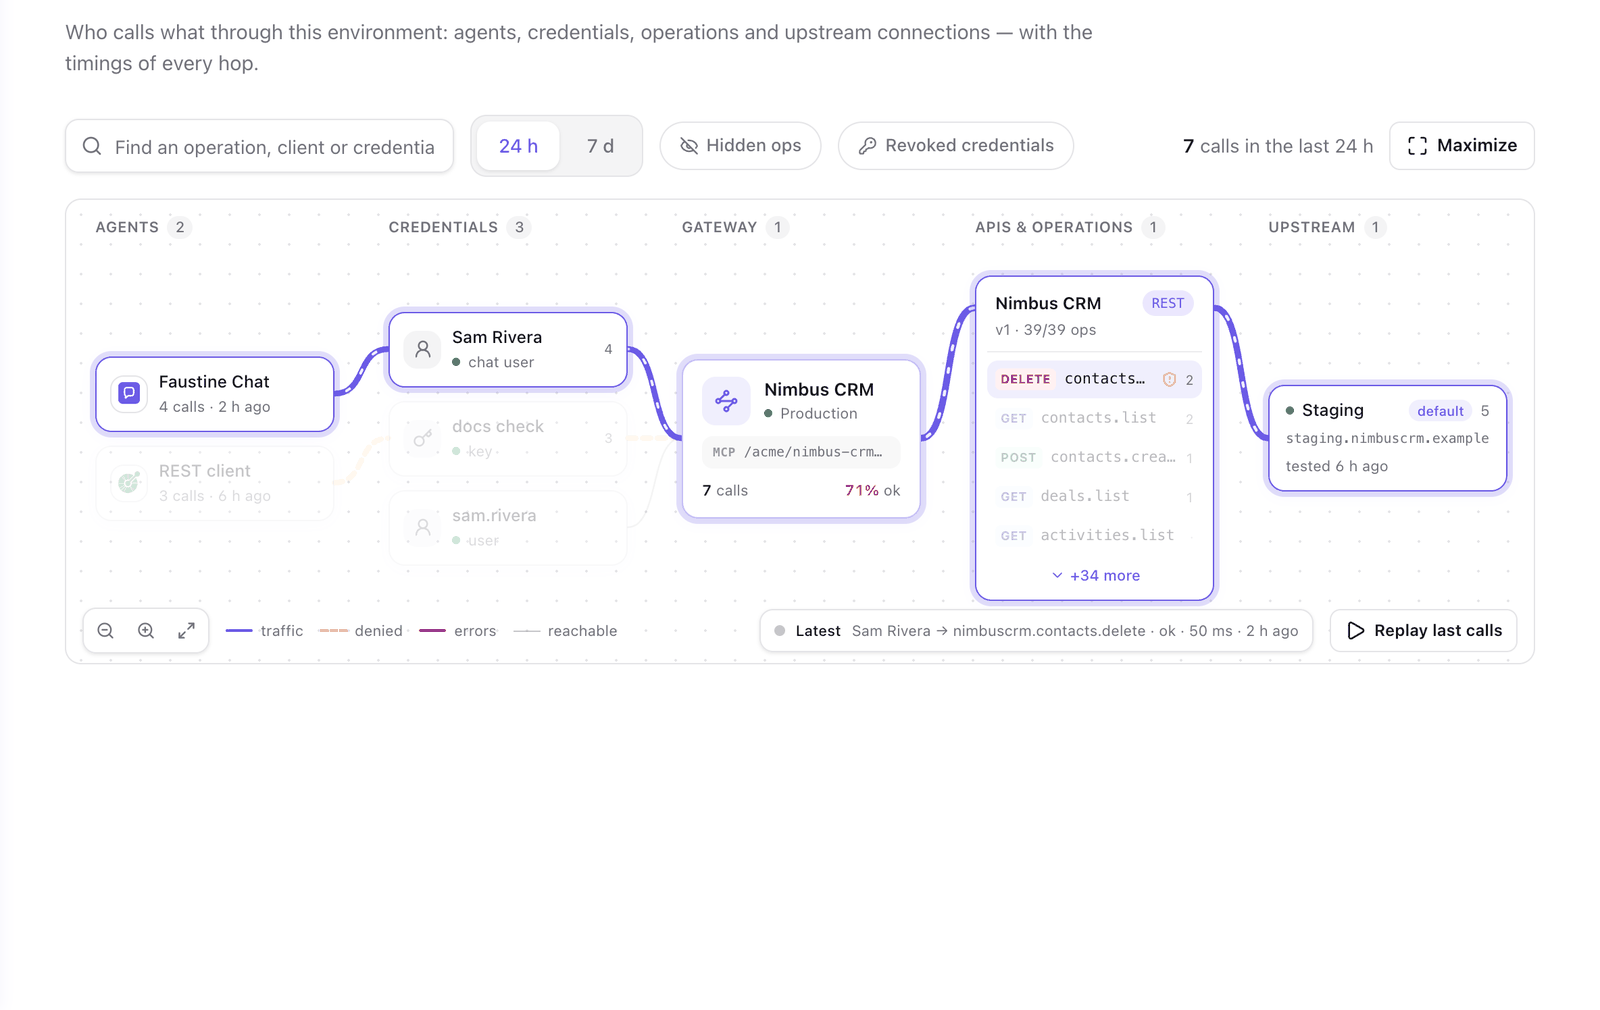
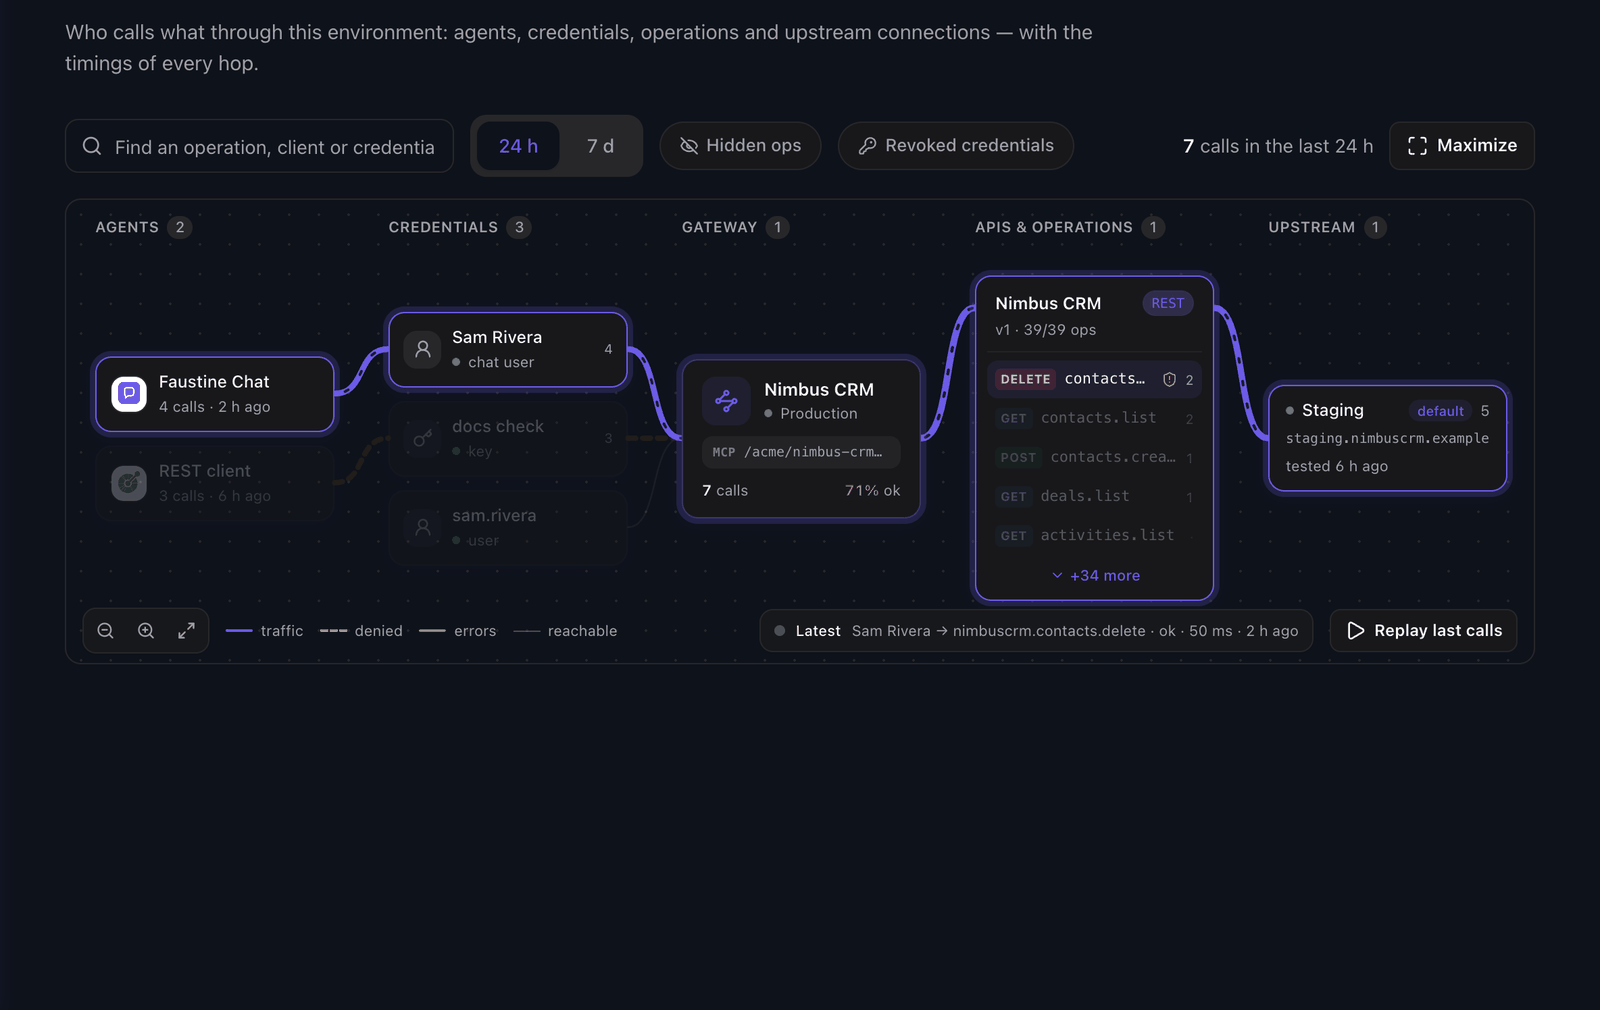
The map has five columns. A line joins two items when calls went from one to the other, or when the configuration allows it.
| Column | Items |
|---|---|
| Agents | The clients that called, such as Claude Code or n8n, identified from each request. |
| Credentials | The API keys and gateway users, each with its state. |
| Gateway | The gateway, with its environment and MCP path. |
| APIs & operations | Each API the environment serves, with its most-called operations listed inside it. |
| Upstream | The connections that reach your API, each with its host and the result of its last test. |
The style of a line says what happened on that path in the window.
| Line | Meaning |
|---|---|
| Solid, in the accent color | Traffic. The width follows the number of calls. |
| Dashed, amber | Most calls on the path were denied by the gateway before they reached the API. |
| Red | Most calls on the path failed at the API or in the gateway. |
| Thin, grey | Reachable by configuration, with no calls in the window. |
A gateway with nothing to show yet has a placeholder in the empty column, such as "No calls yet" or "No API served yet", with a link to the tab where you fix it.
Time window
The map counts the calls of the last 24 h or the last 7 d. Choose the window in the toolbar. The sparkline of a selected item has one bar per hour in the 24 h window and one per 6 hours in the 7 d window. The map loads new calls every 30 seconds.
Select an item
Hover over an item or a line to highlight its whole path. Select it to keep the path highlighted and open the details panel. Press Esc or select the background to clear the selection.
The panel shows, for the selection and the window:
- Calls, with the number denied and the number of errors.
- OK rate.
- Latency, as p50 and p95.
- Last call.
- A sparkline of calls over the window.
- Recent calls, the last five through the selection. Select one to trace it on the map.
Under these, the panel shows facts that depend on the kind of item, and links to the page where you manage it.
| Selection | The panel also shows |
|---|---|
| Agent | The credentials it used. |
| Credential | Its scopes, the APIs and operations it can reach, and the agents that used it. |
| Gateway | Its MCP URL and REST base, the APIs it serves and its most-used credentials. |
| API | How many operations are exposed and hidden, its most-called operations and its connections. |
| Operation | Its key, what it does, its path, whether it is read-only or requires confirmation, the credentials that called it and the connections that served it. |
| Connection | Its base URL, the result of its last test and its most-called operations. |
Toolbar
| Control | What it does |
|---|---|
| Search box | Dims everything that does not match an operation, client or credential. |
| Hidden ops | Shows operations the environment does not expose. |
| Revoked credentials | Shows credentials that have been revoked. |
| Maximize | Opens the map in a window that covers most of the screen. |
| Replay last calls | Traces the last five calls on the map, one after the other. |
To zoom, hold Command or Ctrl and scroll, or use the zoom buttons. To pan, drag the map.
Next steps
- Logs: read the requests behind a path.
- Connect clients: add a client to the first column.
- Scope a key or user: change what a credential can reach.
Last updated November 13, 2026